A news channel asks 1,000 people how they will vote, in a country of 90 crore voters, and says: Party A, 42%, give or take 3. How can 1,000 people speak for 90 crore?
Stranger still, it would be the same "give or take 3" for a country of 1 crore. Think of tasting a spoonful of dal: if the pot is well stirred, one spoonful tells you the salt of the whole pot, whether it's a small pot or a wedding pot. What matters is the size of the spoon, not the pot.
Last issue ended with a puzzle: average anything, many times over, and the misses always pile up in the same hill shape. This issue is about that hill. It is the reason the "±3" exists.
Poll · 1,000 voters asked
Throw a handful of coins
Throw 10 coins on the floor and count the heads. Put a block on that number's pile. Do it again, and again.
The piles near 5 grow tall. The piles at 0 and 10 hardly grow at all. Why? To get 10 heads, every single coin has to land heads, and there is only one way for that to happen. To get 5 heads, any 5 of the 10 coins can be the heads, and there are 252 ways to pick them.
| Heads out of 10 | Ways it can happen |
|---|---|
| 10 | 1 |
| 8 | 45 |
| 5 | 252 |
The middle has many ways to happen. The edges have very few. So the middle wins.
That hill shape is called the bell curve, because it looks like a bell. Coins making a bell is not the surprise. The surprise comes next.
It doesn't care what you average
Coins are tidy. Try something messy: a die, the minutes you wait for a bus, or a shape you draw yourself. The machine takes a few samples, averages them, writes the average down, and repeats that 2,000 times.
The top screen is the thing you are sampling from. The bottom screen is where the 2,000 averages land. The dotted line is the bell the theorem predicts before a single sample is taken.
With 1 sample per average, the bottom just copies the top. By about 5, a hill appears. By 30 it is the same hill every time, whatever shape you started with. Try the bus, or draw something ugly.
Why do the messy shapes disappear? It's the coin reason again. For an average to come out extreme, every sample would have to be extreme in the same direction at once. That is rare. There are far more ways for big ones and small ones to mix and cancel out.
What we sample from
Where 2,000 averages land
What it actually says
When you average many random things, the results pile up in a hill around the truth. The hill always has the same shape, and you can predict how wide it is.
The law of large numbers said the average gets to the truth. This theorem says how far off you are likely to be on the way. And it needs only one formula, the one behind every poll:
likely error ≈ 2 × spread ÷ √(number of samples)
- Spread is how much single answers differ from each other. In a country split down the middle, it is 0.5.
- √, the square root, is why 4 times the samples only halves the error.
- 2 gives you "right about 95 times out of 100".
For the poll: 2 × 0.5 ÷ √1000 ≈ 0.03. That is the ±3. Notice what is not in the formula: the size of the country.
The precise version (skippable)
Take independent samples X₁ … Xₙ from one source with average μ and spread σ, and let X̄ₙ be their average. Then, as n grows,
(X̄ₙ − μ) ÷ (σ / √n) → the standard bell curve N(0, 1)
"→" here means the shape of the pile of averages gets closer and closer to the bell. It says nothing about any one run. The "2" in the plain formula is really 1.96: 95% of the bell sits within 1.96 spreads of its middle.
Where it came from
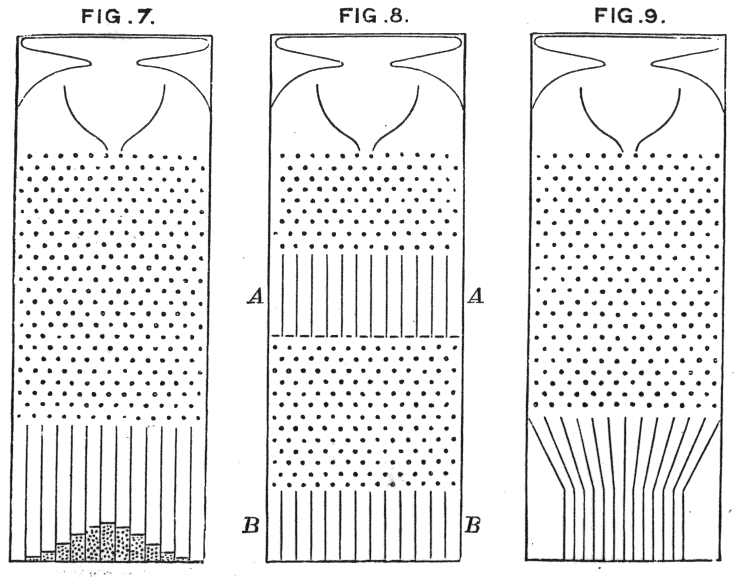
Abraham de Moivre, a French mathematician who made part of his living answering gamblers' questions in London, notices that the number of heads in many coin flips follows a bell-shaped curve. It saves him from adding up enormous lists of numbers. Around 1810, Pierre-Simon Laplace shows the same hill appears for far more than coins. In 1889, Francis Galton draws it as a board of pegs, where falling balls build the hill (above, left panel).
Aleksandr Lyapunov proves it properly, for almost any source.
George Pólya names it the central limit theorem. Central as in most important.
Precision is expensive, again
Because of the square root, every extra point of precision costs more people than the last. Here is the poll's margin of error for a split country:
| People asked | Give or take |
|---|---|
| 100 | ±9.8 points |
| 400 | ±4.9 points |
| 1,000 | ±3.1 points |
| 4,000 | ±1.5 points |
| 10,000 | ±1.0 point |
Going from 1,000 to 10,000 people buys about two points. That's why most polls stop at one or two thousand.
How many before the bell shows up?
It depends on how lopsided the source is. A die looks like a bell by about 5 samples. Bus waits, incomes and other lopsided things take dozens, and the far edges of the hill take longest of all. The popular rule "you need 30" is a habit, not a theorem.
Read the small print
Averaging shrinks noise. It never fixes a biased sample: a poll that only asks city voters gives a confident, wrong answer.
What it promises
- Any shape works→ a bell
Coins, dice, bus waits, your scribble. The hill doesn't care where the numbers came from.
- You know your errorwithout the truth
The poll doesn't know the real answer, yet it can say how far off it probably is.
- The pot's size doesn't matteronly the spoon
1,000 voters give about ±3 for a town of a lakh or a country of 90 crore.
Where it breaks
- Crazy outliersnever settles
Point a torch in a random direction at a very long wall. Usually the spot lands near you. Now and then you point almost along the wall and it lands a kilometre away. One wild spot drags the whole average, so no hill ever forms. Mathematicians call this Cauchy (koh-SHEE) randomness, after Augustin-Louis Cauchy. Pick "Torch" in the machine above.
- Samples that copy each othertoo sure
Ask 1,000 people from one family and you have really asked one opinion many times. The ±3 promise is only for answers that don't copy each other.
- The far edgesrarer on paper
The bell is most accurate in the middle and least accurate at the edges. "Once in 10,000 years" market crashes keep arriving every decade, partly because people trusted the bell's edges.
Build it
Here is the whole method as code. It isn't a copy: the page reads this function out of its own script and runs it in every demo from here down.
Three steps: average the samples, measure their spread, then report the average give or take 1.96 × spread ÷ √n. (1.96 is the precise version of the "2".)
The screen rolls a die n times, builds an interval, and repeats that 100 times. A die's true average is 3.5, the orange line. Green bars caught it. White bars missed. The theorem's promise is that about 95 of 100 catch it, however many rolls you pick.
Where it runs today
Where it runs today
A frog that remembers
A frog hops between three lily pads, numbered 1, 2 and 3. It is lazy: 8 times out of 10 it stays where it is. Over a long time it spends equal time on each pad, so its average pad is 2, exactly like picking a pad at random.
So average 50 frog hops, and compare with averaging 50 pads picked at random. Do both 2,000 times.
Pads picked at random
Following the frog
The hill survived, but it got wider. Each hop remembers the last one. What does randomness with a memory look like? That's the next issue.